
What Causes Injection Molding Defects?
Injection molding defects rarely identify their own cause. A short shot may reflect restricted flow, poor venting, material, machine delivery, or transfer. Warpage may begin with geometry, orientation, cooling, packing, or handling. Turning one setting can hide evidence.
A disciplined diagnosis preserves facts, separates five cause groups, and tests competing explanations. Those groups cover part, mold, material, machine, and process. Good troubleshooting asks what changed, where a symptom appears, and which cavities or lots show it. A controlled trial should reproduce both failure and recovery.
1. What Evidence Should You Capture Before Changing Settings?
Freeze evidence before touching a control. Save parts with time, cavity, cycle, material lot, shift, and machine identity. Photograph each defect location under consistent light. Record trends, alarms, dryer data, coolant conditions, and recent maintenance.
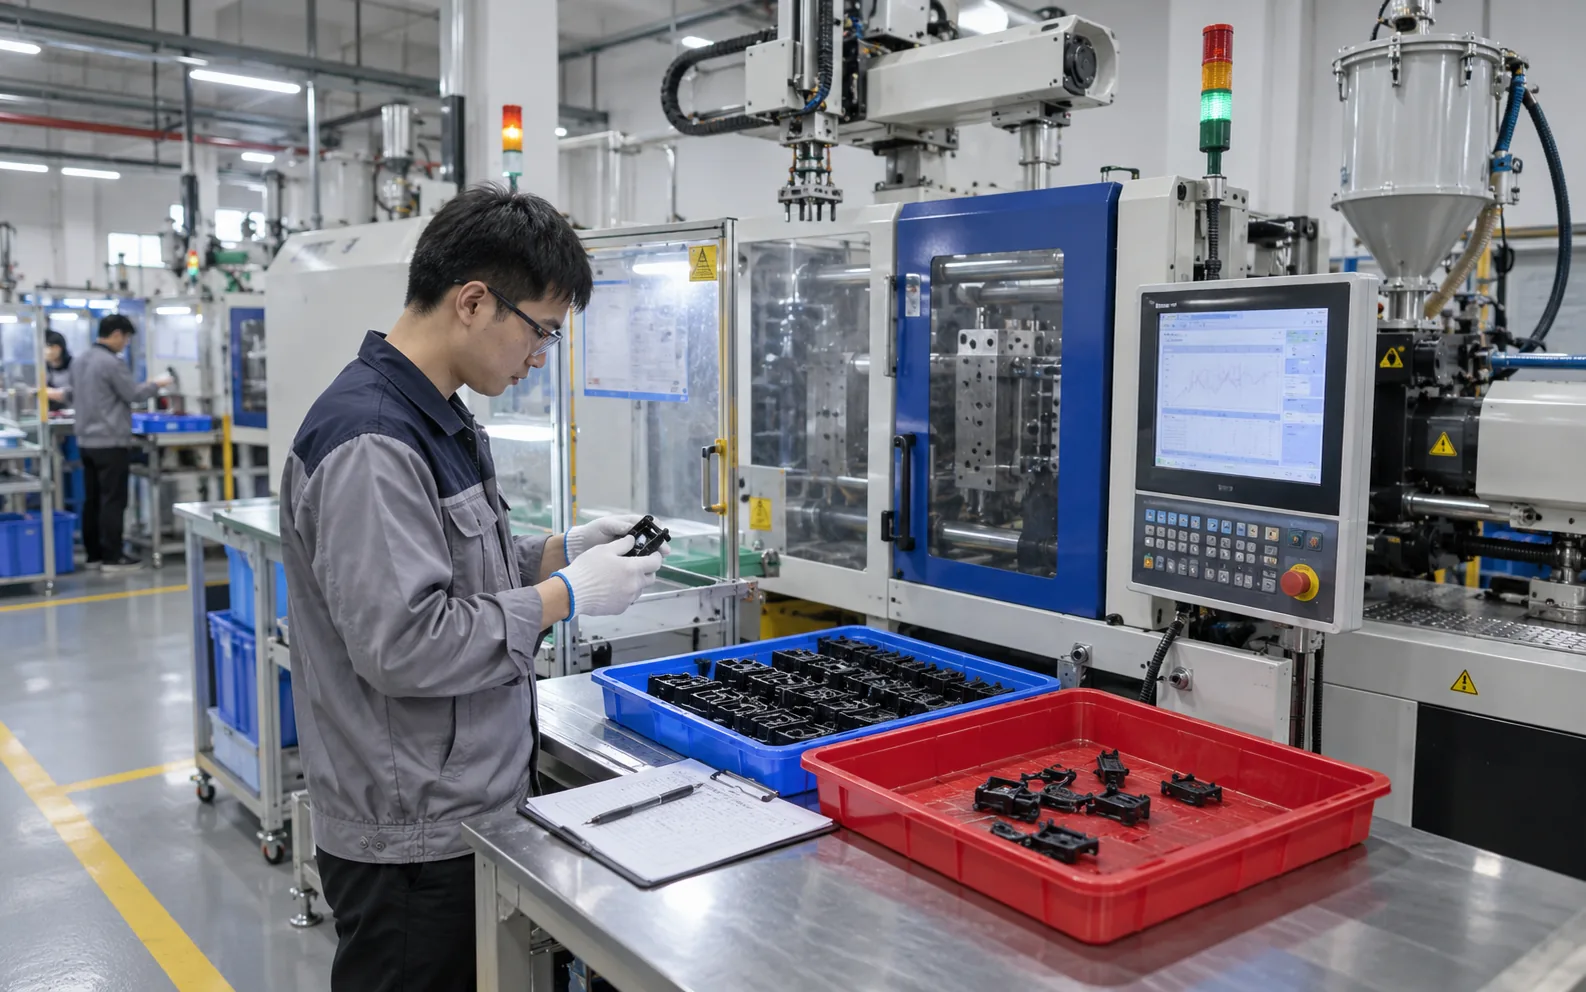
Note whether failure starts at startup, follows a pause, tracks one cavity, or drifts over time. Compare against a known acceptable run with matching units and sensor locations.
Protect the baseline: once several variables move, cause and coincidence become difficult to separate.
- Quarantine samples by cavity, time, and material lot.
- Export trends before screens or buffers overwrite them.
- Record every recent change in tool, resin, machine, and method.
Action: Assign one owner to preserve baseline evidence before any trial.
Decision table: First-response evidence
| Evidence | What it can separate | Weak record | Useful record |
|---|---|---|---|
| Sample map | Cavity, time, location effects | Mixed scrap bin | Labeled sequence by cavity and cycle |
| Process trend | Drift from a known run | Setpoint photo | Actual curves and timestamps |
| Material record | Lot, drying, color, regrind | Resin family name | Grade, lot, dryer, blend record |
| Maintenance history | Physical change | "Tool checked" | Work performed and time returned |
2. Could Part Design Be Creating the Defect?
Defect location may point toward geometry. Sink often follows thick ribs or bosses. Hesitation can develop where flow enters a thin region after filling a thicker path. Sharp corners concentrate molded stress locally. Long flow paths raise freeze-off risk. Weld lines form where fronts meet, and their strength depends on temperature, pressure, venting, resin, and local load.
Part design becomes a stronger hypothesis when failure repeats at one feature. A setting change may hide weakness. Controlled trials can test geometry.
Follow the feature: repeated location usually carries more diagnostic weight than a general defect name.
- Overlay defect position on wall, rib, boss, and flow geometry.
- Compare symmetrical features under similar molding conditions.
- Review functional loads at weld lines and sharp transitions.
Action: Ask product engineering to disposition any geometry-driven risk before permanent process compensation.
Decision table: Part-design evidence
| Symptom pattern | Part feature to inspect | Competing cause | Confirmation method |
|---|---|---|---|
| Local sink | Thick boss or rib junction | Low pack or early gate freeze | Section and geometry trial |
| Repeated warp axis | Uneven wall or stiffness | Cooling or orientation | Dimensional map and trial |
| Weak weld region | Split flow around opening | Venting or cold fronts | Functional test and fill study |
| Crack at corner | Sharp radius or molded stress | Chemical exposure | Radius review and aged test |
3. Could the Mold, Gate, Venting, or Cooling Be Responsible?
Injection mold engineering helps explain why evidence appears by cavity or location. Local flash can indicate parting damage, vent condition, insert fit, or imbalance. End-of-fill burns may suggest trapped gas. Uneven cooling can drive warpage.
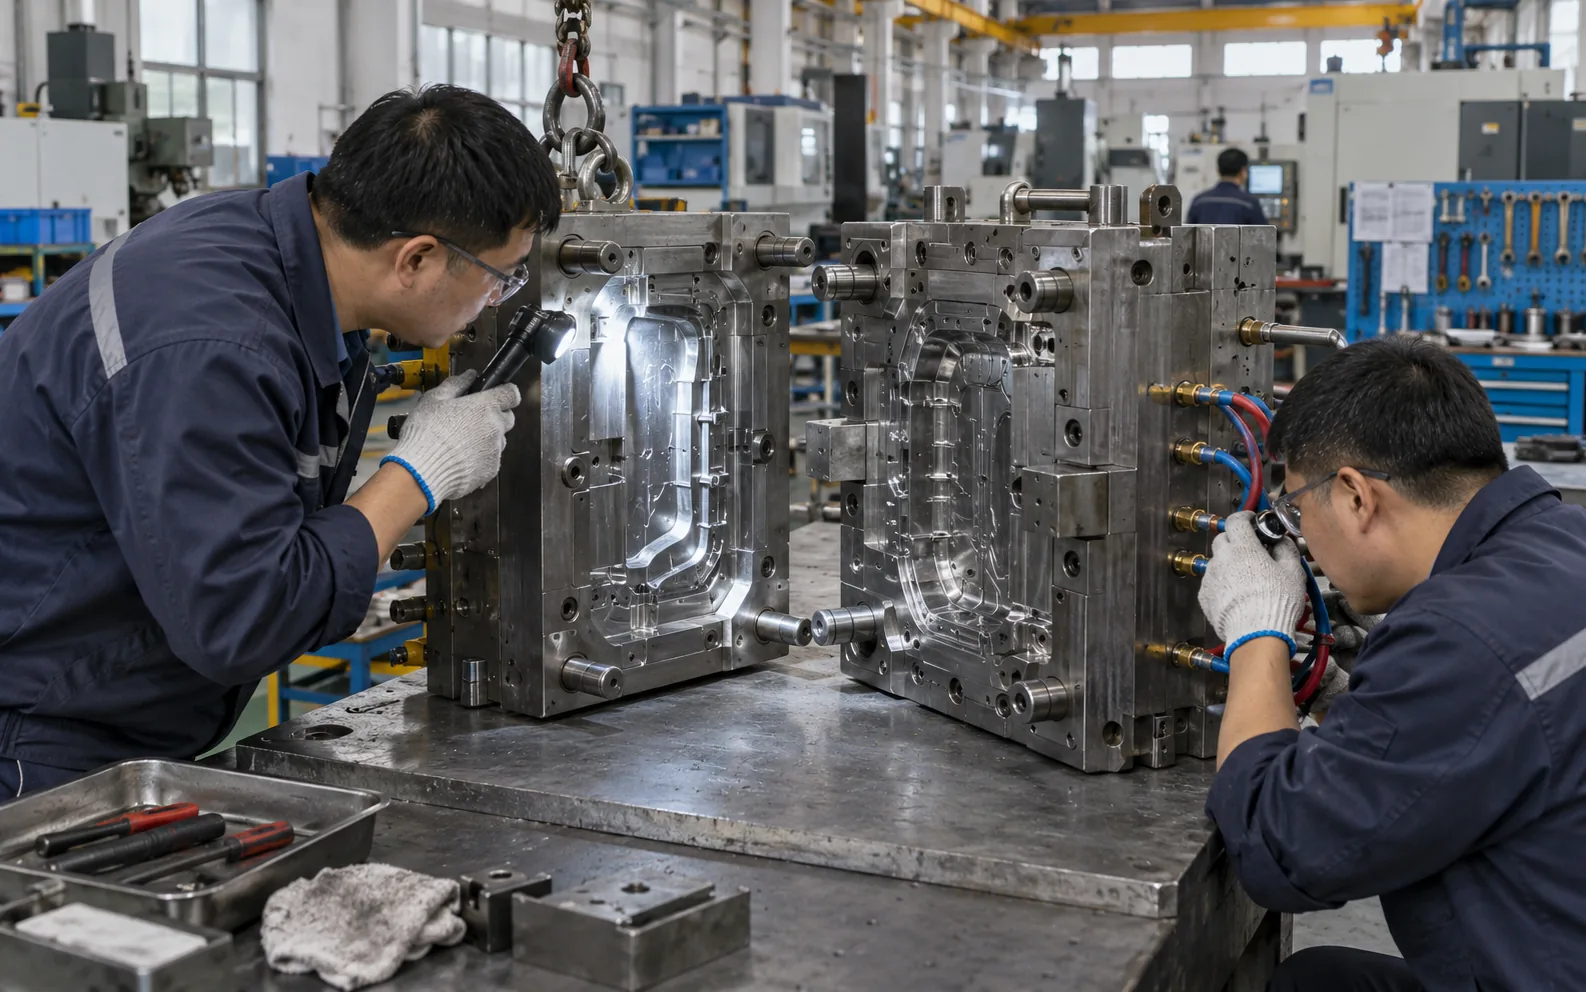
Inspect a stopped, secured tool. Check vents, gates, runners, ejectors, cooling, deposits, and damage. Physical inspection can reveal restrictions that higher pressure only masks.
Read each cavity separately: averaging can hide a local fault.
- Compare cavity weight, fill pattern, defect location, and temperature.
- Verify coolant flow and circuit connection against tool records.
- Measure physical wear or damage instead of relying on appearance alone.
Action: Repair verified mold conditions, then rerun the original baseline before tuning.
Decision table: Mold evidence
| Finding | Likely influence | Evidence check | Corrective path |
|---|---|---|---|
| Blocked vent | Burns, short fill, deposits | Location and vent inspection | Clean or restore verified vent |
| Gate wear | Fill or gate-mark change | Gate measurement and cavity weight | Repair and confirm balance |
| Cooling restriction | Warp, gloss, cycle drift | Flow and temperature comparison | Restore circuit performance |
| Parting damage | Local flash | Blue check or measured gap | Repair shutoff or support |
4. Could Material Condition or Handling Be Responsible?
Verify exact resin identity before changing process. Check grade, lot, color, regrind, storage, drying, purge history, and packaging. Moisture may damage affected materials. Contamination can create streaks, delamination, specks, or erratic flow.
Material becomes a stronger suspect when a defect follows one lot, color, dryer, or changeover. Quarantine that stream and compare it with material from a known condition.
Trace every handful: resin family labels cannot reveal lot or handling history.
- Verify dryer operation with actual conditions and supplier guidance.
- Inspect loaders, hoses, hoppers, grinders, and purge paths for carryover.
- Retain sealed reference material and molded samples from each lot.
Action: Run a controlled material comparison while every machine and process condition remains documented.
Decision table: Material evidence
| Evidence | Possible mechanism | Controlled comparison | Decision |
|---|---|---|---|
| High moisture or poor drying | Splay, hydrolysis, weak surface | Known-dry material | Restore handling and retest |
| Mixed pellets | Contamination or incompatible blend | Clean system and sealed lot | Quarantine affected material |
| New color | Carrier or pigment effect | Natural or approved prior color | Validate exact color package |
| Excess regrind | Variable heat history or fines | Virgin baseline | Reset and qualify allowed ratio |
5. Could Machine or Auxiliary Equipment Be Responsible?
A controller can display stable settings while delivered behavior changes. Check-ring leakage may alter shot delivery. Heater or sensor faults can create temperature variation. Weak dryers or coolant units can mimic process problems.
Compare actual position, time, pressure, temperature, cushion, recovery, and part weight across consecutive cycles. An alternate press offers comparison evidence, not automatic proof of machine failure.
Commanded and delivered are different records: confirm what equipment produced.
- Trend actual values over enough cycles to reveal variation.
- Verify calibration and hardware condition with maintenance methods.
- Check auxiliary equipment under production load, not while idle.
Action: Ask maintenance to confirm suspected hardware with measurements before replacement.
Decision table: Machine evidence
| Symptom in data | Hardware question | Independent check | Interpretation limit |
|---|---|---|---|
| Variable cushion | Is material leaking past check ring? | Repeatability or leakage test | Also review transfer and feed |
| Unstable recovery | Is feed, screw, or back pressure erratic? | Recovery trend and inspection | Material handling may contribute |
| Temperature mismatch | Are heater and sensor working correctly? | Independent temperature check | Reading location affects result |
| Speed deviation | Can drive deliver profile under load? | Actual velocity trend | Pressure limit may intervene |
6. Could the Process Window Have Shifted?
A stable process describes more than a recipe. Fill time, transfer, pressure, cushion, part weight, cooling, and recovery should remain within proven ranges. Cavity pressure adds evidence where sensors exist.
Find a measured shift before choosing its cause. Material, venting, or cooling may move similar signals. Give each controlled change a predicted result.
Make each trial answer one question: random tuning produces noise.
- Define target responses before changing any variable.
- Hold unrelated settings, material, and sampling method constant.
- Keep a rollback point and repeat enough cycles after stabilization.
Action: Use a written trial sheet that links hypothesis, change, prediction, and result.
Decision table: Process evidence
| Process signal | What changed data may indicate | Related checks | Trial discipline |
|---|---|---|---|
| Fill time | Viscosity, restriction, speed delivery | Lot, gate, vent, machine | Compare at stable melt condition |
| Transfer pressure | Flow resistance or transfer shift | Position and cavity response | Change one factor |
| Cushion | Shot delivery or leakage | Check ring and feed | Review cycle sequence |
| Part weight | Pack delivery or gate freeze | Cavity and hold profile | Sample after stabilization |
7. How Do You Trace Short Shots, Flash, Burns, and Weld Lines?
These symptoms involve flow, pressure, or gas, yet each carries competing causes. Short shots may follow delivery, freeze-off, venting, gate restriction, or pressure limits. Flash may follow cavity pressure, support, damage, or contamination. Burns may indicate trapped gas or degradation.
Weld lines need location and function review. Appearance may change with speed or temperature while gate layout, venting, material, and load direction still control strength.
Location beats labels: end-of-fill burn and barrel degradation demand different tests.
- Map symptom position against gate, vent, and flow-front meeting points.
- Compare cavities for weight, pressure, flash, and fill sequence.
- Inspect damaged steel or blocked vents before raising clamp or pack.
Action: Confirm a flow-related correction across repeated cycles and every affected cavity.
Decision table: Flow-related defects
| Defect | Competing hypotheses | Best early evidence | Avoid assuming |
|---|---|---|---|
| Short shot | Freeze-off, venting, delivery, restriction | Fill sequence and actual pressure | More pressure always fixes it |
| Flash | Parting damage, clamp support, overpack | Cavity location and tool inspection | Clamp setting is sole cause |
| Burn | Trapped gas, degradation, contamination | Defect location and purge history | Higher venting solves every burn |
| Weld line | Flow layout, temperature, venting, resin | Meeting-point map and strength test | Appearance predicts strength |
8. How Do You Trace Sink, Voids, Warpage, and Dimensional Drift?
Shape and dimension defects require timed measurement. Sink and voids may relate to thick sections, packing, gate freeze, cooling, or material behavior. Warpage can reflect shrinkage, orientation, cooling, geometry, packing, or ejection.
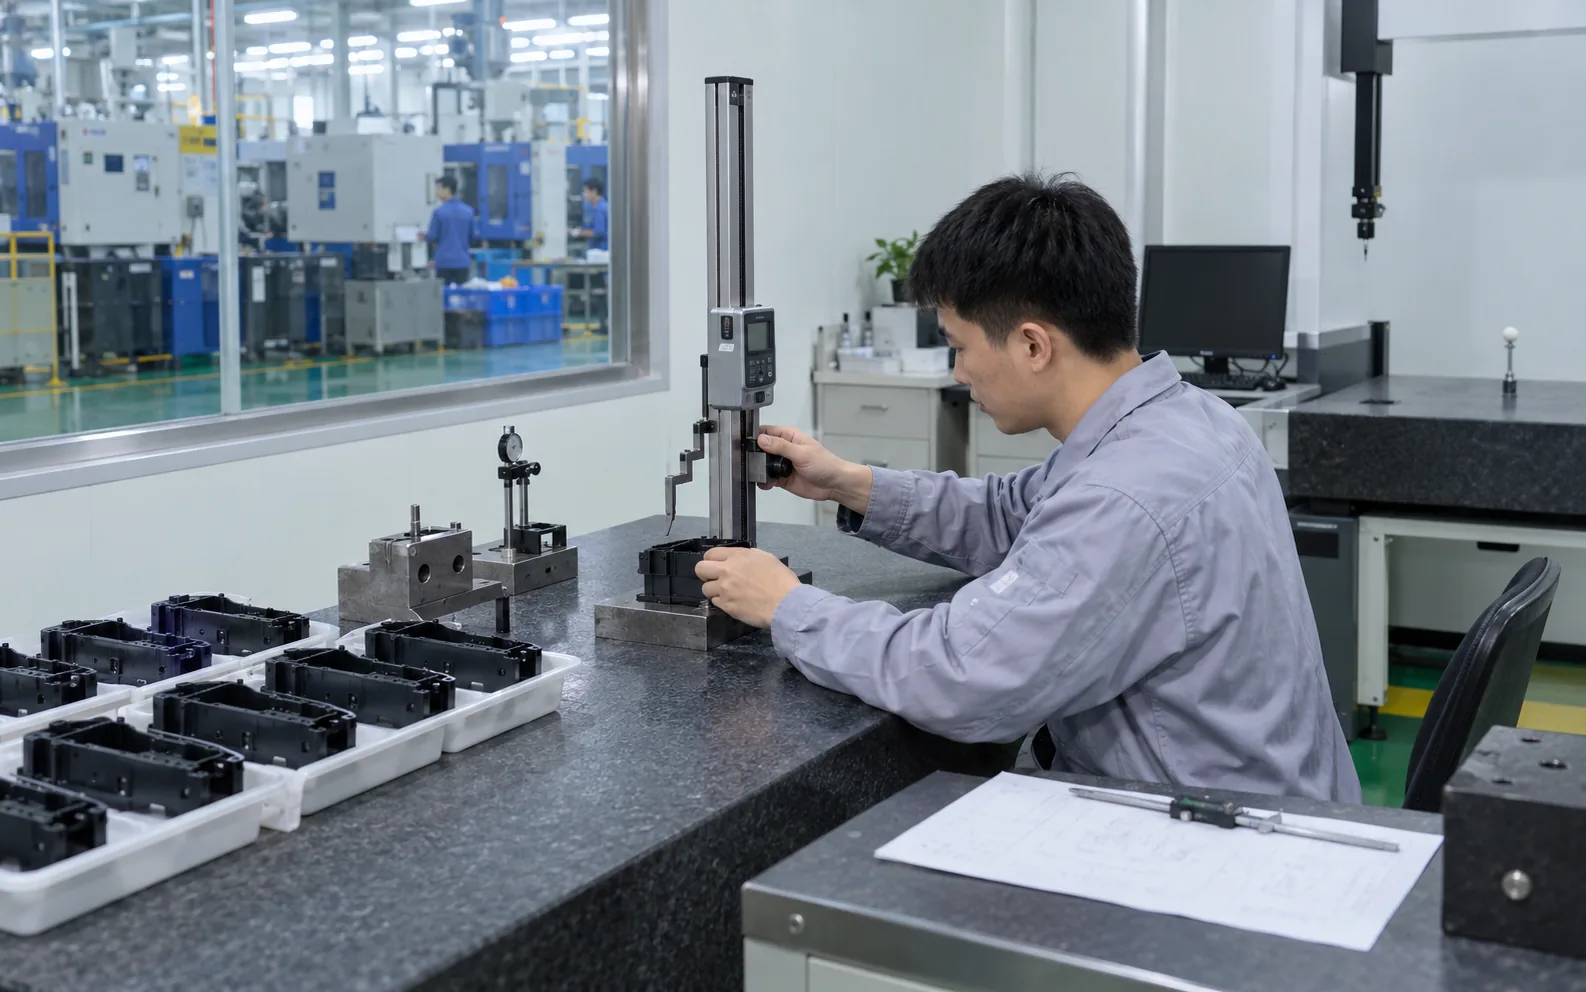
Set a conditioning interval before measurement. Parts may move after ejection or moisture exposure. Compare cavity, flow direction, feature, and time across a full dimensional map.
Measure after the part settles: mixed timing creates false drift.
- Define measurement temperature, conditioning, fixture, and interval.
- Compare dimensions along and across flow where orientation matters.
- Section suspect heavy regions when surface evidence cannot separate sink from void.
Action: Validate any dimensional correction against function, all cavities, and agreed conditioning.
Decision table: Shape and dimensional defects
| Defect | Geometry evidence | Process or mold evidence | Confirmation |
|---|---|---|---|
| Sink | Thick local mass | Pack and gate-freeze behavior | Section and timed appearance check |
| Void | Internal heavy section | Packing and cooling history | Section or suitable imaging |
| Warpage | Asymmetric wall or stiffness | Cooling, orientation, ejection | Cavity map and controlled trial |
| Size drift | Sensitive dimension | Thermal or process trend | Timed measurement series |
9. How Do You Trace Streaks, Delamination, and Black Specks?
Surface evidence needs careful classification. Moisture streaks, fiber marks, carryover, burns, and silvering can look similar. Delamination may arise from contamination, additives, or degradation. Black specks may originate in resin, dead spots, residue, or prior color.
Use clean samples, magnification, purge observation, and lot history. Microscopy or sectioning can separate surface deposit from internal failure. Supplier guidance controls purge and temperature limits.
Do not diagnose by color alone: trace source, depth, and timing.
- Compare defect under fixed light and magnification.
- Track whether it follows lot, color, startup, pause, or long run.
- Inspect purge paths and dead zones under safe maintenance conditions.
Action: Prove removal of the suspected source, then run a clean baseline long enough to challenge recurrence.
Decision table: Surface and material defects
| Symptom | Candidate source | Evidence that helps | Controlled response |
|---|---|---|---|
| Silver streak | Moisture, gas, shear | Drying and location pattern | Compare known-dry lot |
| Delamination | Incompatible material or additive | Section and material trace | Clean system and isolate lot |
| Black speck | Degradation, dead spot, contamination | Timing and purge inspection | Remove source and challenge run |
| Fiber streak | Orientation, surface replication | Flow direction and mold condition | Review gate and process window |
10. How Do You Prove a Correction and Prevent Recurrence?
A plausible explanation remains a hypothesis until controlled evidence proves it. Use a broader guide to tracing defects back to the mold when the pattern points toward tooling. Reproduce failure where safe, apply one correction, and compare against acceptance criteria. A rollback test can strengthen causality.
Release needs repeated cycles, all cavities, relevant lots, and functional checks. Update setup, maintenance, material, inspection, and training controls. Monitor early production for drift or buildup.
Finish with control, not relief: one good shot proves very little.
- Record root cause, correction, verification, and residual risk.
- Define production monitoring limits and reaction ownership.
- Preserve samples and data that show before, after, and rollback states.
Action: Release production only after repeated evidence meets agreed quality and functional criteria. Send defect photos, cavity map, material record, process trends, and recent change history with any supplier review request.
Frequently Asked Questions
FAQ 1: Should operators change one setting as soon as a defect appears?
Preserve samples and actual data first. Safety or containment may require an immediate change, but record baseline conditions and isolate suspect output.
FAQ 2: Why does a defect in one cavity matter so much?
A cavity-specific pattern points toward local gate, vent, cooling, insert, ejection, or damage. It can prevent machine-wide changes.
FAQ 3: Can scrap parts still help after production stops?
Yes, when cavity, time, lot, and sequence remain traceable. Mixed scrap loses value because patterns cannot be reconstructed.
FAQ 4: Does mold-flow analysis prove a defect cause?
Simulation can test flow, air-trap, pressure, cooling, and warpage hypotheses. Results still need accurate inputs and molding evidence.
FAQ 5: How many good parts prove that a correction worked?
No universal count fits every product. Define a validation run from risk, cavity count, process stability, lot variation, and functional needs.