
What Is Mold Flow Analysis and When Do You Need It?
Mold flow analysis models how molten polymer may fill, pack, cool, shrink, and deform inside a proposed mold. Buyers often receive bright contour plots without a clear decision behind them. A useful study connects every result with geometry, material data, tooling assumptions, machine limits, and a recommended change. It can expose expensive risks before steel work begins. Yet simulation remains a prediction. Tool trials, molded samples, cavity-pressure data, and dimensional inspection provide physical evidence. Use analysis where uncertainty could force costly tool changes, then review its assumptions as closely as its pictures.
1. What is mold flow analysis?
Mold flow analysis divides part and runner geometry into many small elements. A solver calculates flow, pressure, temperature, solidification, and related behavior across them. Scope may cover filling alone or extend through packing, cooling, fiber orientation, shrinkage, and warpage.
- Filling predicts how a melt front advances through each cavity.
- Packing evaluates pressure transfer after volumetric fill.
- Cooling models heat removal through part, mold, and circuits.
- Warpage estimates deformation after shrinkage and stress develop.
Keep one distinction in view. Simulation answers “what may happen under these assumptions?” A trial answers “what happened with this tool, material lot, machine, and process?”
Decision table: what each analysis can support
| Analysis output | Decision it can support | Limit you should retain |
|---|---|---|
| Fill pattern | Gate location and filling sequence | Depends on geometry, viscosity data, and process inputs |
| Pressure | Machine fit and pressure margin | Predicted pressure needs correlation with actual equipment |
| Cooling | Circuit layout and hot-zone review | Boundary conditions may not match shop-floor heat transfer |
| Warpage | Compensation or geometry changes | Direction and trend may be more reliable than an exact value |
Action recommendation: ask each report page to name its decision, assumption, and planned physical check.
2. What decisions can simulation support before steel is cut?
A pre-tooling study can test DFM decisions before steel is cut while CAD changes remain relatively cheap. Engineers may compare gates, runners, cavity layouts, wall transitions, cooling circuits, and local geometry. Good work also checks machine pressure, clamp capacity, and shot control.
- Place gates where flow length and cosmetic needs can coexist.
- Balance cavities before runner dimensions become fixed in steel.
- Move likely weld lines away from seals, clips, or show surfaces.

Now connect each plot with a choice. A red pressure zone has little value without a response, such as wider flow channels, another gate, a resin review, or a machine check. Recommendations must also mention any new weld line, vestige, shear, or tooling complication created by that response.
Decision table: linking results with design action
| Design question | Useful result | Possible action |
|---|---|---|
| Will each cavity fill evenly? | Fill time and pressure balance | Resize runners or revise gate layout |
| Where might fronts meet? | Weld-line location and temperature | Shift gate or move a stressed feature |
| Can heat leave evenly? | Mold temperature and cooling results | Rework circuit spacing or local cooling |
| Will shape drift after ejection? | Warpage components and shrinkage | Adjust geometry, packing, cooling, or compensation |
Action recommendation: approve a design change only after checking its effect across filling, packing, cooling, and part function.
3. When is mold flow analysis worth the cost?
Simulation earns its place when a wrong assumption could trigger recutting, added gates, late machine changes, or repeated trials. Part size alone does not set risk. A small thin-walled housing may present harder filling conditions than a larger open shape.
- Long or thin flow paths create pressure and freeze-off risk.
- Multiple cavities raise balance and consistency questions.
- Fiber-filled resin adds orientation-driven shrinkage concerns.
- Tight show surfaces restrict gate and weld-line locations.
- Inserts may move or disturb flow under uneven pressure.
A simple screen works well. Count unknowns that affect irreversible tooling choices. Simulation becomes easier to justify when several unknowns interact or when one failure would demand major steel work.
Decision table: risk triggers for a study
| Risk trigger | Possible consequence | Value from simulation |
|---|---|---|
| Thin, distant feature | Short shot or excessive pressure | Compare gate and thickness options |
| Multi-cavity layout | Uneven filling or packing | Evaluate runner balance before cutting |
| Tight cosmetic zone | Visible weld line or blush | Compare flow-front meeting locations |
| Fiber-filled grade | Directional shrinkage or distortion | Review orientation and warpage trends |
Action recommendation: commission a focused study when one high-cost trigger or several moderate triggers remain unresolved after DFM.
4. When can a project proceed without a full study?
A full analysis may add little value for forgiving geometry with known resin, generous walls, proven gating, and broad dimensional allowances. Production knowledge can lower uncertainty when a supplier has molded comparable flow length, thickness, material grade, and machine scale.
- Use a geometry review for simple, low-risk parts.
- Apply proven design rules where conditions closely match.
- Run a fill-only screen when gating remains uncertain.
- Escalate if later changes add cavities, thin ribs, or strict cosmetics.
A lean approach still needs evidence. Record which risks are low, what precedent supports that view, and which trial measurements will test it.
Decision table: choosing a lighter approach
| Project condition | Lean approach | Escalation trigger |
|---|---|---|
| Simple constant wall | DFM plus gating review | Longer flow path or thinner local area |
| Proven part family | Use documented process precedent | New resin grade or major scale change |
| Single forgiving cavity | Trial plan with pressure monitoring | Added cavities or narrow machine margin |
| Early concept geometry | Quick fill comparison | Frozen tooling direction or strict tolerances |
Action recommendation: document why a study was omitted and define an escalation gate before steel release.
5. What inputs make a study credible?
Output quality cannot outrun input quality. A polished report based on obsolete CAD or generic resin can misdirect a team. Geometry should include meaningful ribs, bosses, runners, gates, inserts, and cooling features. Material selection should match an actual grade because related grades can behave differently.
- Current native or clean solid geometry with revision control.
- Exact resin grade, filler level, and supplier data record.
- Runner, gate, venting, insert, and cavity assumptions.
- Cooling channels, mold materials, and thermal boundaries.
- Mesh statistics and local refinement around small features.
This is where weak reports unravel. Missing inputs should appear as assumptions, never as invisible defaults. Sensitivity runs can show whether a decision survives plausible variation in melt temperature, mold temperature, flow rate, or material data.
Decision table: input checks before trusting output
| Input | Review check | Failure mode if wrong |
|---|---|---|
| CAD revision | Match released geometry | Results address an obsolete part |
| Resin record | Match exact commercial grade | Pressure and shrinkage predictions drift |
| Gate and runner | Match proposed tool concept | Fill pattern lacks decision value |
| Mesh | Show statistics and local density | Thin features or curves are misrepresented |
Action recommendation: reject any report that hides material, mesh, geometry revision, or process assumptions.
6. Which results deserve the closest review?
Review results as a linked system. Fill time shows flow-front movement, while pressure indicates required effort. Meeting temperature affects weld-line risk. Packing and cooling influence shrinkage, residual stress, and warpage.
- Check fill sequence for hesitation, race tracking, and imbalance.
- Review pressure at gate, end-of-fill, and narrow sections.
- Inspect weld lines near loads, seals, or visible surfaces.
- Compare cooling uniformity before reading warpage alone.
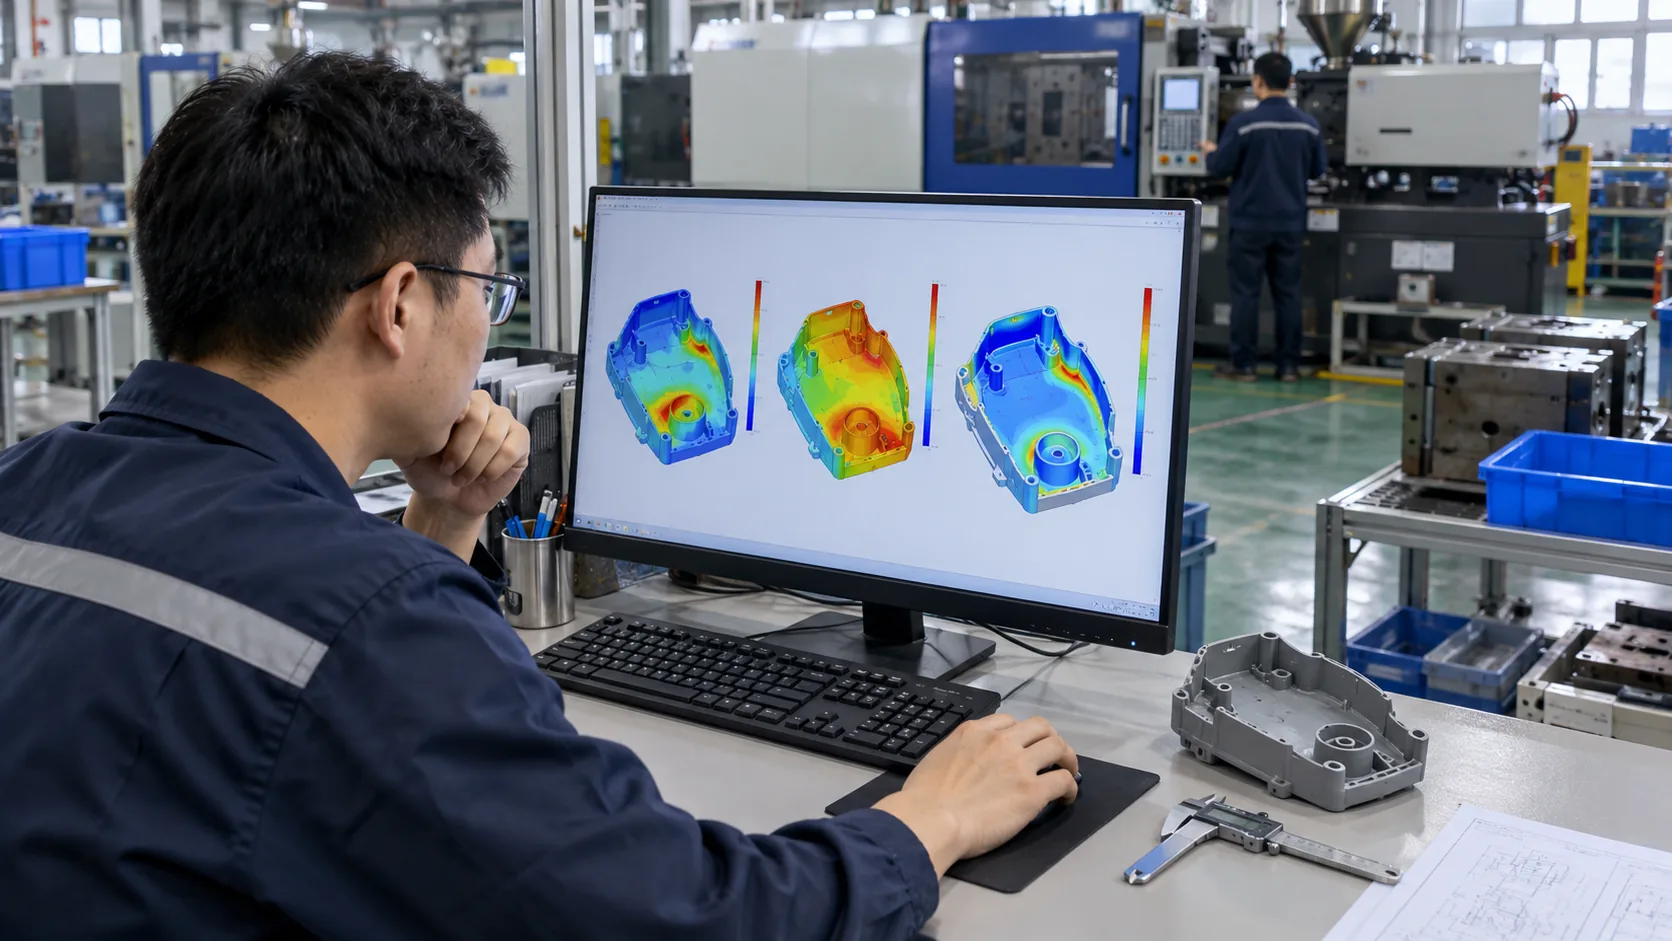
One green map cannot clear a tool. Automatic quality labels compress several calculations into a convenient view. Engineering review should return to underlying pressure, temperature, shear, cooling, shrinkage, and deformation results.
Decision table: results and common reading errors
| Result | Decision question | Misleading reading |
|---|---|---|
| Fill time | Does flow reach every region in a stable sequence? | Treating equal color as proof of good packing |
| Pressure | Does proposed equipment retain workable margin? | Equating solver pressure with guaranteed machine pressure |
| Weld line | Does meeting location threaten function or appearance? | Assuming location alone predicts joint strength |
| Warpage | Which mechanism drives deformation? | Approving an exact number without trial correlation |
Action recommendation: require cause-separated warpage and supporting fill, pack, and cool results before approving compensation.
7. How should you review a mold flow report?
Begin with scope before studying images. Confirm part revision, analysis sequence, material record, mesh type, runner model, cooling model, and machine assumptions. Find a baseline and each tested variant. Useful comparisons keep unrelated inputs fixed.
- Scope and revision appear on a cover or setup page.
- Inputs are visible, traceable, and technically plausible.
- Baseline problems are stated without sales language.
- Variants answer named questions with matched scales.
- Trial checks connect predictions with measurable evidence.
Look for reasoning between pictures. A report should explain why a result occurs, how a proposal changes that mechanism, and what downside remains. Screenshots without causal analysis are presentation material rather than an engineering decision record.
Decision table: report review checklist
| Report item | Evidence expected | Warning sign |
|---|---|---|
| Model scope | Revision, sequence, mesh, and boundaries | Scope remains implicit |
| Material | Exact grade and data quality | Generic family selected without comment |
| Variant comparison | Controlled inputs and common scales | Several variables change together |
| Recommendation | Mechanism, tradeoff, and validation step | “Pass” label without acceptance logic |
Action recommendation: return a report for revision when its recommendation cannot be traced back through inputs and results.
8. How should design alternatives be compared?
Alternative studies work best as controlled experiments. Keep resin data, machine setup, mesh policy, and evaluation criteria stable while changing one variable where practical. Combined changes should still identify each targeted mechanism.
- Define baseline failure or risk before creating variants.
- Use identical legends and viewpoints for visual comparisons.
- Compare numeric probes at matching locations.
- Record new risks introduced by each alternative.
Tradeoffs belong in open view. A larger gate may reduce pressure yet leave an unacceptable vestige. Another gate may move a weld line while adding runner complexity. A colder region may improve cycle potential but worsen shrinkage balance elsewhere.
Decision table: fair comparison rules
| Comparison dimension | Fair method | Approval evidence |
|---|---|---|
| Gate option | Same resin, process window, and result scale | Better flow with acceptable vestige and weld line |
| Wall change | Same gate and machine assumptions | Lower risk without functional compromise |
| Cooling concept | Same part and packing setup | More uniform temperature and acceptable complexity |
| Warpage correction | Separate geometry effect from process effect | Stable trend across sensitivity cases |
Action recommendation: choose a variant from a written tradeoff matrix, not from whichever contour plot looks calmest.
9. What evidence is needed after simulation?
Simulation should shape a trial plan. Place sensors or inspection points where predictions show sensitivity. Record actual melt, mold, fill, transfer, pack, and cooling conditions. Compare fill progression, cavity balance, part weight, defects, and dimensions with predicted trends.
- Short-shot stages reveal actual filling sequence.
- Cavity pressure traces show transfer and packing behavior.
- Thermal checks test cooling assumptions.
- Dimensional layouts reveal shrinkage and warpage outcomes.
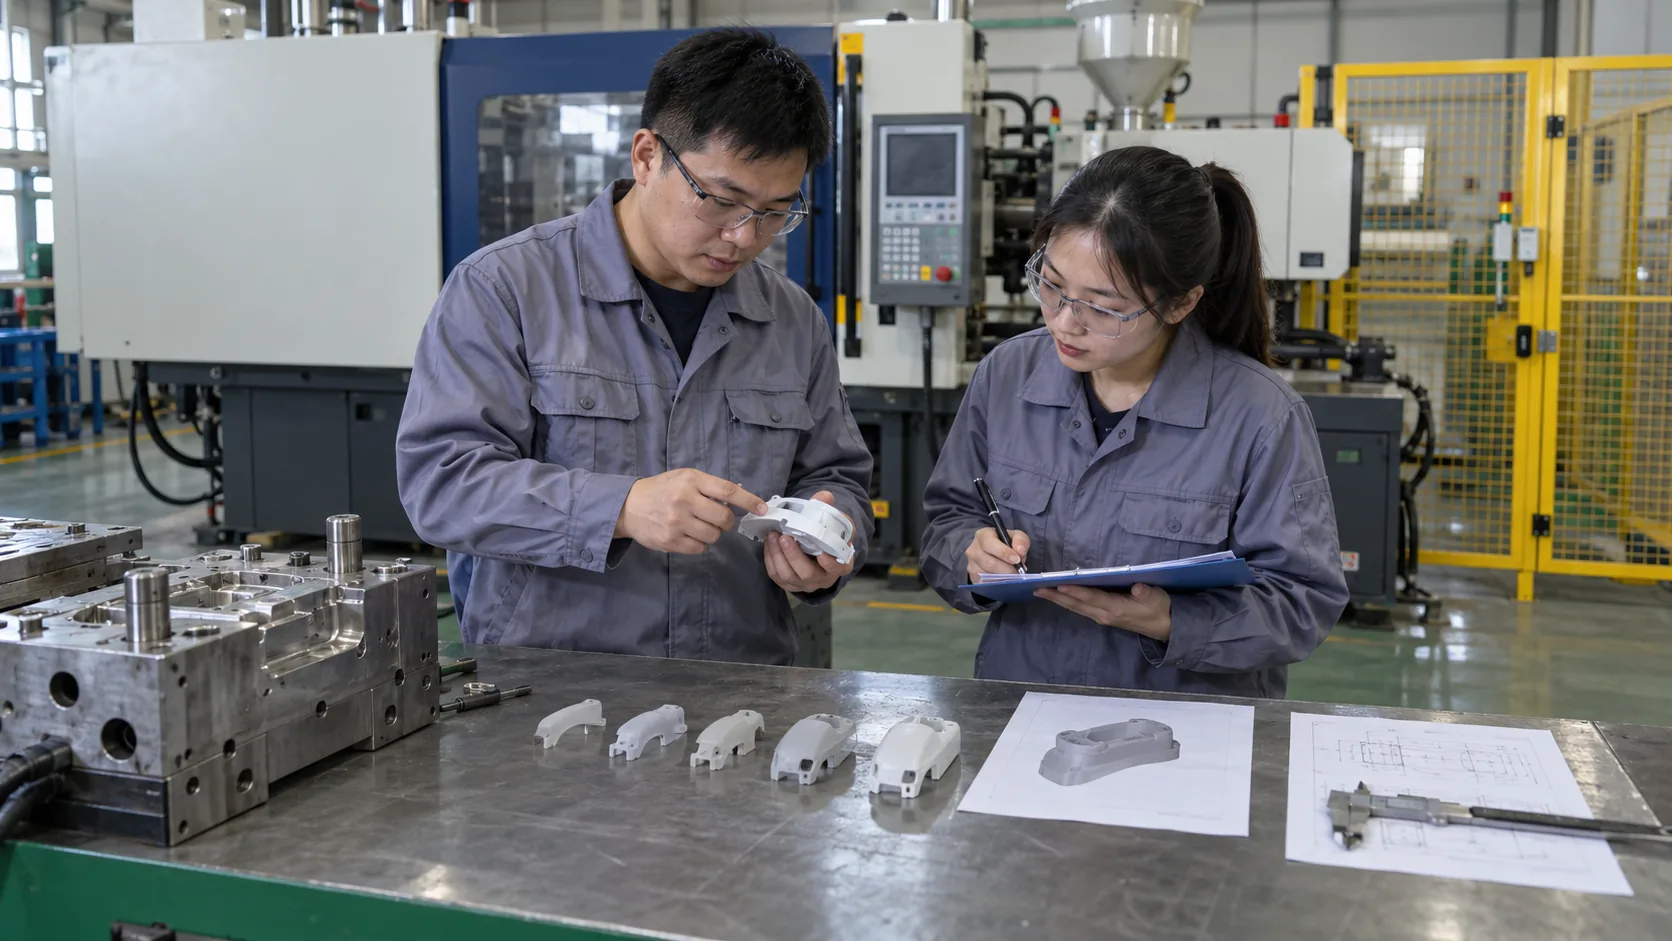
Disagreement can be useful evidence. A mismatch may reveal wrong resin data, an inaccurate boundary, an unmodeled venting effect, machine response, or tool-build deviation. Update assumptions before claiming that either model or trial “failed.”
Decision table: evidence after virtual analysis
| Stage | Evidence collected | Uncertainty that remains |
|---|---|---|
| Simulation | Predicted trends and sensitive regions | Actual tool, machine, and material behavior |
| Tool trial | Fill pattern, pressure, appearance, and samples | Long-run drift and lot variation |
| Dimensional review | Measured shrinkage and deformation | Process-window stability |
| Production run | Capability across time and normal variation | Future maintenance and change effects |
Action recommendation: add predicted-versus-measured checks to each trial report and revise future models from those findings.
10. How should you request mold flow analysis from a supplier?
A clear request begins with a decision rather than a software name. Tell your supplier which tooling choices remain open, which defects are unacceptable, and what evidence supports release. Share geometry, resin grade, machine range, appearance zones, critical features, and proposed mold architecture.
- Name open decisions such as gate, cavity, runner, or cooling layout.
- Define functional and cosmetic no-go zones.
- Request baseline plus relevant alternatives.
- Require visible inputs, assumptions, and mesh checks.
Make scope fit project risk. A fill-only review may suit an early gate choice. A high-risk dimensional part may need fill, pack, cool, shrinkage, and warpage work plus sensitivity cases.
Action recommendation: classify each project as low, moderate, or high simulation need before requesting a quote. Then purchase only enough analysis to resolve named irreversible decisions, while reserving final approval for trial and measurement evidence.
Frequently Asked Questions
Q1: Can mold flow analysis guarantee a defect-free part?
No guarantee follows from simulation. It predicts behavior for a modeled setup. Tool construction, venting, machine response, material variation, and actual processing can differ, so trials and inspection remain necessary.
Q2: Should a study use the exact resin grade?
Yes, whenever suitable data exists. Grades from one polymer family can have different viscosity, thermal, shrinkage, or filler behavior, which changes result confidence.
Q3: Can simulation predict weld-line strength?
It can predict likely meeting locations and local process conditions. Strength also depends on material, contamination, venting, surface condition, geometry, and molding reality, so testing may be required.
Q4: Do you need analysis for every design revision?
Not every revision needs another run. Re-run cases that alter flow path, thickness, gate, material, cavity balance, cooling, or another assumption tied to a prior decision.
Q5: Who should approve a mold flow report?
Part design, tooling, molding, and quality representatives should review decisions within their scope. One analyst should not carry approval for every functional and production risk.